AI trading chart analysis — a full read in under 60 seconds
Drop a screenshot or type a ticker. You get directional bias with a conviction score, marked support and resistance, detected patterns, entry, stop, targets, R:R and the exact invalidation — across the 5m, 4H and 24h horizons.
3 analyses/day free · no card required · cancel any time
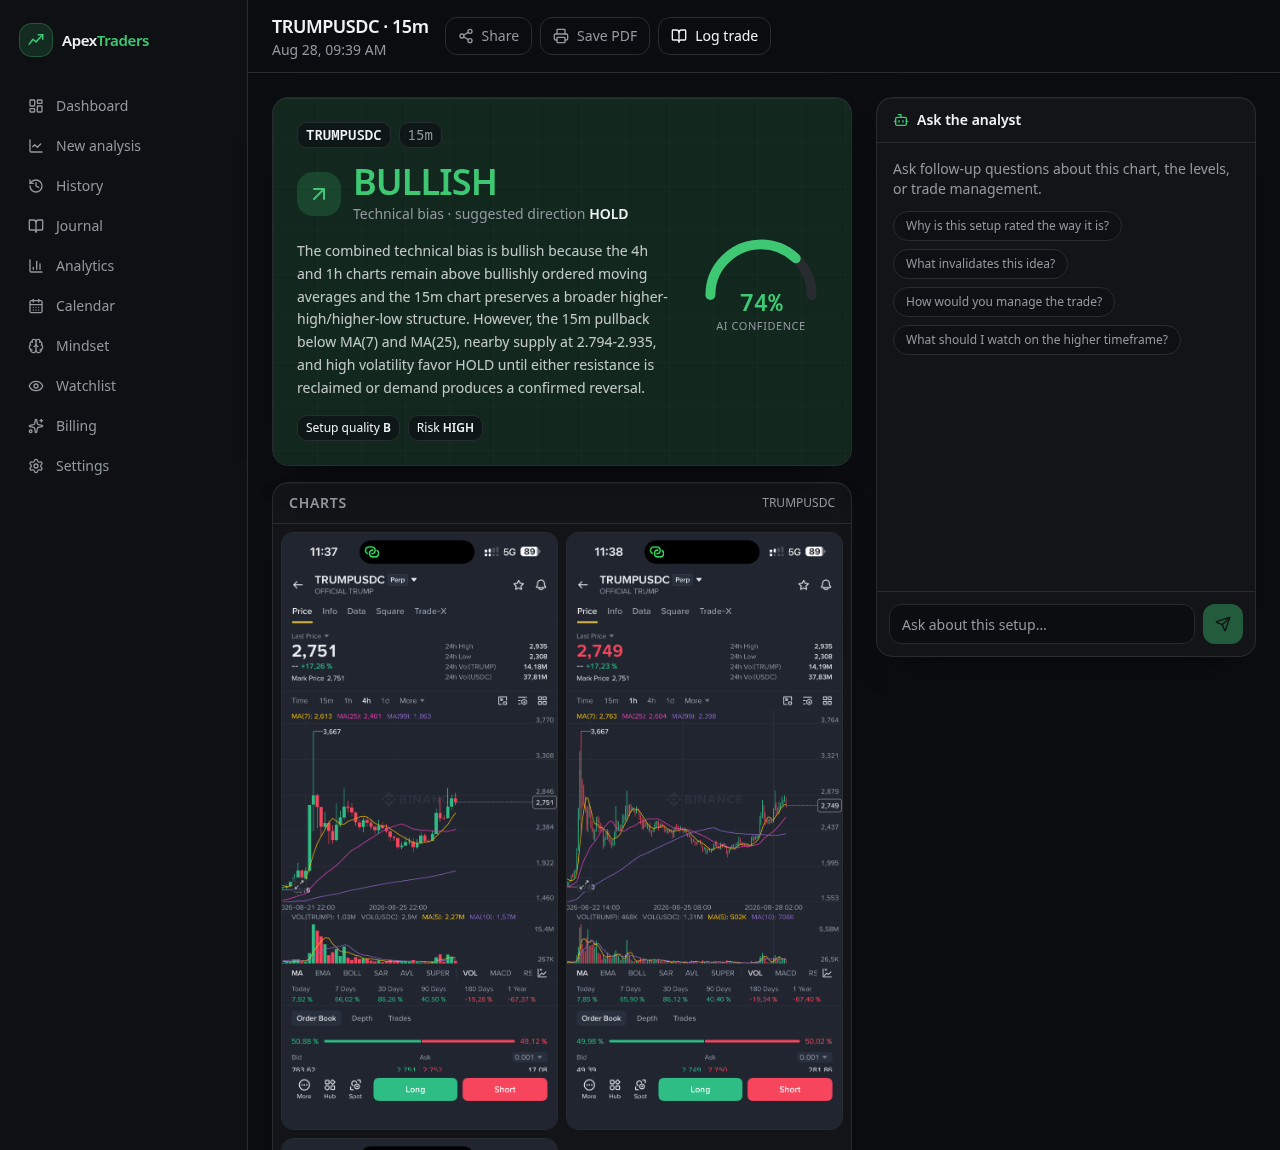
screenshot to a full structured report
multi-horizon outlook on every analysis
scalp, swing, smart money, institutional and more
How it works
How our AI technical analysis works
- 01
Screenshot or ticker
Drop a chart from TradingView, MT4/5 or your broker — indicators and drawings included. Or type a ticker and we pull live price and candles.
Any market · any timeframe - 02
Vision model reads the tape
Structure, momentum, key levels, liquidity, patterns and risk — parsed into a fixed schema so nothing is left vague.
Structured output · < 60s - 03
Executable plan
Bias and conviction, entry, stop, targets, R:R and the exact invalidation price — across 5m, 4H and 24h. Then interrogate it in chat.
Entry · Stop · Targets · R:R
Where edge leaks
Most losing trades were process errors
Not bad luck — the same four mistakes, repeated. A structured second read on every chart, before you size in, is how you stop paying for them.
- Chasing extended moves after the impulse is already spent
- Taking LTF setups that fight the higher-timeframe trend
- Entering without a marked invalidation, so the stop becomes emotional
- No post-trade review, so the same error repeats for months
Bullish · 72% conviction — structure intact, higher lows holding on the 4H.
6/8 signals aligned. Momentum divergence is the single dissenting input.
Entry 64,180 · Stop 62,940 · TP1 66,500 · TP2 68,300 · R:R 2.4
4H close below 62,900 breaks structure — thesis void, stand aside.
Generated in 41 seconds from a single screenshot.
Inside every analysis
AI chart pattern recognition, levels and execution
Every report fills the same schema, so you compare like for like across symbols and sessions.
Directional bias & conviction
Long, short or stand aside, with a confidence score you can size against.
Trend structure & momentum
Market structure, higher-high/lower-low state and momentum quality right now.
Entry, stop & targets
A concrete execution plan with risk/reward computed, not implied.
Support, resistance & liquidity
Reaction levels, supply/demand zones and where liquidity is likely resting.
Pattern recognition
Chart and candlestick patterns detected, with the statistical bias each usually carries.
Multi-horizon outlook
Separate 5m, 4H and next-day reads so HTF/LTF conflict is explicit.
Bull vs bear scenarios
Both paths mapped with probabilities and the trigger that confirms each.
Invalidation & risk flags
The exact price that kills the thesis, plus event and volatility risks to watch.
Follow-up chat
Interrogate the read — sizing, timing, alternative entries, what-ifs — in context.
3 analyses/day free · no card required
Comparison
Versus manual analysis and generic chatbots
| Capability | ApexTraders | Manual analysis | Generic AI chatbot |
|---|---|---|---|
| Structured, repeatable output | |||
| Concrete entry, stop and targets | |||
| Computed risk/reward | |||
| Multi-timeframe conflict flagged | |||
| Delivered in under a minute | |||
| Graded hit-rate tracking | |||
| Journal & analytics built in |
Your trading terminal
AI trading tools built around the analysis
Reports, history, journal, analytics and watchlists in one workspace — so every idea is measurable after the fact.
Dashboard
Today's analyses, graded accuracy and behavioural insights in one view.
Hit-rate · TodayHistory
Every report archived, searchable and filterable by outcome.
Filter by win / lossJournal & analytics
Log fills and review realised P/L, expectancy and win rate by setup.
P/L · ExpectancyWatchlists
Your traded symbols one tap from a fresh analysis.
Majors · Alts · IndicesAnalysis modes
Quick read, swing, scalp, smart money, institutional or deep dive.
6 modesTimeframe confluence
Stack up to three timeframes and surface disagreement before you size in.
1H · 4H · 1DPricing — save 50% annually
Start free with 3 analyses a day. Upgrade when the workflow pays for itself.
Free
Test the workflow on a few charts a day.
- 3 chart analyses per day
- Quick analysis mode
- Analysis history
- Basic AI chat
Pro
Most popularFor active traders who review charts daily.
$174 billed yearly · save $174
≈ $0.02 per analysis at full usage
- 30 chart analyses per day
- All analysis modes
- Multi-timeframe confluence
- Advanced AI assistant
- Trading journal + analytics
- Watchlists
Elite
Maximum throughput and deeper analytics.
$474 billed yearly · save $474
≈ $0.01 per analysis at full usage
- 150 chart analyses per day
- Priority processing
- Smart Money & institutional modes
- Advanced journal analytics
- Early access to API
No card required to start · cancel any time · paid access runs to the end of the period
Frequently asked
What exactly does the AI chart analysis return?
A structured read: directional bias with a conviction score, trend structure and momentum, marked support/resistance and liquidity zones, detected chart and candlestick patterns, an execution plan (entry, stop, targets, R:R), the invalidation level, and bull vs bear scenario probabilities.
Which model powers the analysis?
A frontier multimodal vision model reads the chart image directly, then a structured schema forces every field — levels, R:R, invalidation — to be filled. You get consistent output instead of free-form chat text.
Does it read indicators and volume?
Yes. Anything visible on the chart is fair game — moving averages, RSI, MACD, volume bars, VWAP, order blocks, fibs, drawn trendlines. Leave your indicators on the screenshot and the model uses them.
How does it handle multi-timeframe conflict?
Every report includes a multi-horizon outlook covering the 5m scalp, 4H intraday and next-day view, each with its own bias, key levels and invalidation — so an HTF/LTF disagreement is stated explicitly rather than hidden.
Which markets and platforms are supported?
Crypto, forex, equities, indices and commodities. Screenshots from TradingView, MetaTrader 4/5, Binance, Bybit, Coinbase or any broker terminal all work. You can also skip the screenshot and type a ticker — live price and candles are pulled for you.
How do I know if the calls are any good?
Grade each analysis as a win, loss or breakeven once price resolves. Your dashboard then tracks realised hit-rate by market, session and setup type — measured on your own tape, not a marketing number.
What happens to the charts I upload?
Your uploads and reports are private to your account and stored under row-level access control. Sharing is opt-in: flipping the share switch mints a read-only public link you can revoke at any time.
What is included on the free plan?
Three analyses per day, full history and AI chat. No card required, and you can cancel a paid plan at any time.
Run it on your next setup
Three analyses a day, free forever. Upload one chart and see what the model flags that you didn't.
Try it for freeNo card required · cancel any time